
In the world of modern software development, monitoring is crucial for understanding how your applications are performing in production. OpenTelemetry, Prometheus, and Grafana are powerful tools that can be used together to monitor and visualize key metrics from your applications. In this blog post, we'll walk you through the process of setting up and using this monitoring stack to gain insights into your application's performance.
I'd like to thank Manish Shrestha and Christian Kjær Larsen who helped me in understanding OpenTelemetry and setting up the environment.
Prerequisites
Before we dive into the setup, make sure you have the following prerequisites in place:
- Docker and Docker Compose installed on your system.
- Basic knowledge of Docker and containerization.
- Node.js and npm installed.
- Familiarity with Prometheus and Grafana.
Setting Up the Environment
We'll use Docker Compose to set up our monitoring stack, which includes OpenTelemetry Collector, Prometheus, Grafana and a Express Server powered by node.
To get started, let's create a directory named otel and go to the directory.
$ mkdir otel

$ cd otel
Now, create three folders namely collector, prometheus, and rest-app.
$ mkdir collector

$ mkdir prometheus

$ mkdir rest-app
OpenTelemetry Configuration
OpenTelemetry Collector plays a vital role in collecting metrics from your application. Now inside the collector folder create a new file otel-collector-config.yaml which specifies the required configuration. Here's a snippet of that configuration:
receivers:
  otlp:
    protocols:
      grpc:

exporters:
  prometheus:
    endpoint: "0.0.0.0:8889"

processors:
  batch:

service:
  pipelines:
    metrics:
      receivers: [otlp]
      processors: [batch]
      exporters: [prometheus]
In this configuration:
- We use the OTLP receiver to accept metrics in gRPC format.
- We specify the Prometheus exporter to export metrics to Prometheus.
Prometheus Configuration
Prometheus is responsible for scraping metrics from the OpenTelemetry Collector. Also, now inside the prometheus folder create a file prometheus.yaml which contains configuration for scraping metrics from the OpenTelemetry.
scrape_configs:
  - job_name: "otel-collector"
    scrape_interval: 10s
    static_configs:
      - targets: ["otel-collector:8889"]
      - targets: ["otel-collector:8888"]
This configuration instructs Prometheus to scrape metrics from the OpenTelemetry Collector every 10 seconds.
Configuring Grafana
To visualize metrics, we need to configure Grafana to use Prometheus as a data source. Before we move ahead, download this zip file, extract(unzip) the file and move the folder grafana in our root folder otel. The folder grafana should contains following folders and files.
├── grafana.ini
└── provisioning
    ├── dashboards
    │   └── opentelemetry-collector.json
    └── datasources
        └── default.yaml
The file grafana/provisioning/datasources/default.yaml should contain the configuration which tells Grafana to use Prometheus as a data source with the name "Open-Telemetry-Example."
apiVersion: 1

datasources:
  - name: Open-Telemetry-Example
    type: prometheus
    url: http://prometheus:9090
    editable: true
Custom Metric Agent
To demonstrate how metrics are collected, we have a sample Node.js application located in the rest-app directory. This application uses OpenTelemetry to instrument a simple Express.js web server. Inside the rest-app folder run:
If using yarn:
$ yarn init -y
If using npm:
$ npm init -y
A file package.json file will be created inside the rest-app folder. Now, install these dependencies.
Yarn:
$ yarn add @opentelemetry/api @opentelemetry/exporter-metrics-otlp-grpc @opentelemetry/resources @opentelemetry/sdk-metrics axios
NPM:
$ npm install @opentelemetry/api @opentelemetry/exporter-metrics-otlp-grpc @opentelemetry/resources @opentelemetry/sdk-metrics axios
After installing the required node packages, create a couple of files index.js and meter.js and add the following contents into it.
meter.js
//meter.js

"use strict";

const { Resource } = require("@opentelemetry/resources");
const { metrics } = require("@opentelemetry/api");
const {
  OTLPMetricExporter,
} = require("@opentelemetry/exporter-metrics-otlp-grpc");
const {
  MeterProvider,
  PeriodicExportingMetricReader,
} = require("@opentelemetry/sdk-metrics");

const meterProvider = new MeterProvider({
  resource: new Resource({ "service.name": "my-express-app" }),
});

const metricExporter = new OTLPMetricExporter({
  url: "http://otel-collector:4317",
});

const metricReader = new PeriodicExportingMetricReader({
  exporter: metricExporter,
  exportIntervalMillis: 60000,
});

meterProvider.addMetricReader(metricReader);

metrics.setGlobalMeterProvider(meterProvider);
The code sets up a MeterProvider and a PeriodicExportingMetricReader:
- MeterProvider: Defines the configuration for metric collection, including a resource attribute (service name).
- OTLPMetricExporter: Specifies the exporter for metrics, which exports them in OTLP gRPC format.
- PeriodicExportingMetricReader: Configures how often metrics are exported (every 60 seconds).
index.js
// index.js
require("./meter");
const { metrics } = require("@opentelemetry/api");

const meter = metrics.getMeter("express-server");
let counter = meter.createCounter("learn-with-pratap", {
  description: "The number of requests per name the server got",
});

const express = require("express");
const app = express();
app.get("/user/:name", (req, res) => {
  const data = {
    route: "/user/:name",
    name: req.params.name,
  };
  counter.add(1, data);
  console.log({ data });
  res.send("Hello " + req.params.name);
});

app.listen(process.env.PORT || 8080, () => {
  console.log("Server is up and running");
});
The index.js file:
- Requires the meter.js file to set up metric collection.
- It creates an Express.js web server and defines a single route.
- When a request is made to the /user/:name route, it increments a metric (counter) called learn-with-pratap by 1 and logs some data.
Dockerizing the rest-app
Let us get started by creating a file Dockerfile inside the rest-app folder and have the following contents
# Dockerfile
FROM node:16

WORKDIR /my-app

COPY yarn.lock package.json ./

RUN npm install

COPY . .

CMD ["node", "index.js"]
This Dockerfile is used to create a Docker image for a Node.js application:
-
FROM node:16:- Specifies the base image to use for the Docker image. In this case, it's a Node.js image based on version 16.
-
WORKDIR /my-app:- Sets the working directory inside the container to
/my-app. This is where subsequent commands will be executed.
- Sets the working directory inside the container to
-
COPY yarn.lock package.json ./:- Copies the
yarn.lockandpackage.jsonfiles from the local directory into the/my-appdirectory inside the container. This is done before runningnpm installto make use of Docker's layer caching.
- Copies the
-
RUN npm install:- Installs the Node.js dependencies specified in
package.json.
- Installs the Node.js dependencies specified in
-
COPY . .:- Copies the entire content of the local directory (which includes your application source code) into the
/my-appdirectory inside the container. This step allows the application code to be included in the Docker image.
- Copies the entire content of the local directory (which includes your application source code) into the
-
CMD ["node", "index.js"]:- Specifies the default command to run when a container based on this image is started. In this case, it runs
node index.js, assumingindex.jsis the main file for your application.
- Specifies the default command to run when a container based on this image is started. In this case, it runs
In summary, this Dockerfile sets up a Node.js environment, copies the package information and installs dependencies, then copies the application code. Finally, it defines the default command to start the application when a container is launched.
Let us now add a new file .dockerignore to ignore or avoid to copy the node_modules folder. Let's add the content as below.
node_modules/
.env
npm-debug.log
Configuring the Docker Compose file
Inside the otel folder create a new file docker-compose.yaml which defines the services and configurations needed to run OpenTelemetry, Prometheus and Grafana.
# docker-compose.yaml
version: "2"
services:
  rest-app:
    build: ./rest-app
    ports:
      - "8080:8080"
    environment:
      PORT: 8080
    depends_on:
      - otel-collector
  otel-collector:
    image: otel/opentelemetry-collector-contrib:latest
    command: ["--config=/etc/otel-collector-config.yaml", ""]
    volumes:
      - ./collector/otel-collector-config.yaml:/etc/otel-collector-config.yaml
    ports:
      - "1888:1888" # pprof extension
      - "8888:8888" # Prometheus metrics exposed by the collector
      - "8889:8889" # Prometheus exporter metrics
      - "13133:13133" # health_check extension
      - "4317:4317" # OTLP gRPC receiver
      - "55679:55679" # zpages extension
      - "4318:4318"

  prometheus:
    image: quay.io/prometheus/prometheus:v2.34.0
    command: --config.file=/etc/prometheus/prometheus.yml --no-scrape.adjust-timestamps
    volumes:
      - ./prometheus/prometheus.yaml:/etc/prometheus/prometheus.yml
    ports:
      - "9090:9090"

  grafana:
    image: grafana/grafana:9.0.1
    container_name: grafana
    volumes:
      - ./grafana/grafana.ini:/etc/grafana/grafana.ini
      - ./grafana/provisioning/:/etc/grafana/provisioning/
    ports:
      - "3000:3000"
Let's break down each service in the provided docker-compose.yaml file:
- rest-app:
- build: ./rest-app: Specifies that the image for this service should be built using the Dockerfile located in the ./rest-app directory.
- Ports: Maps the port 8080 of the host system to the port 8080 inside the container. This allows external access to the service.
- Environment: Sets an environment variable PORT with the value 8080. This variable is likely used by the application inside the container.
- Depends On: Specifies that this service depends on another service named otel-collector. This means that otel-collector will be started before rest-app.
-
otel-collector:
- Image: It uses the
otel/opentelemetry-collector-contrib:latestDocker image, which is the OpenTelemetry Collector. - Command: The
--config=/etc/otel-collector-config.yamlflag specifies the configuration file for the collector. - Volumes: It mounts the local
./collector/otel-collector-config.yamlfile into the container at/etc/otel-collector-config.yaml, allowing you to provide a custom configuration. - Ports: Exposes various ports for different functionalities:
1888:1888: Exposes the pprof extension for profiling and debugging.8888:8888: Exposes Prometheus metrics generated by the collector.8889:8889: Exposes Prometheus exporter metrics for scraping by Prometheus.13133:13133: Exposes the health_check extension for checking the health of the collector.4317:4317: Exposes the OTLP (OpenTelemetry Protocol) gRPC receiver for receiving telemetry data.55679:55679: Exposes the zpages extension, which provides debugging and profiling endpoints.4318:4318: Exposes another port, although the purpose is not specified in this file.
- Image: It uses the
-
prometheus:
- Image: It uses the
quay.io/prometheus/prometheus:v2.34.0Docker image, which is Prometheus, a monitoring and alerting toolkit. - Command: Specifies the configuration file to use with
--config.file=/etc/prometheus/prometheus.yml. Additionally,--no-scrape.adjust-timestampsis used to prevent timestamp adjustment for scraped metrics. - Volumes: Mounts the local
./prometheus/prometheus.yamlfile into the container at/etc/prometheus/prometheus.yml, allowing you to provide a custom Prometheus configuration. - Ports: Exposes port
9090, which is the default port for the Prometheus web UI and API.
- Image: It uses the
-
grafana:
- Image: It uses the
grafana/grafana:9.0.1Docker image, which is Grafana, a popular open-source platform for monitoring and observability. - Container Name: Sets the name of the container to "grafana" for easy reference.
- Volumes: Mounts two directories:
./grafana/grafana.iniinto/etc/grafana/grafana.ini, allowing you to provide a custom Grafana configuration../grafana/provisioning/into/etc/grafana/provisioning/, which is typically used for provisioning data sources and dashboards in Grafana.
- Ports: Exposes port
3000, which is the default port for accessing the Grafana web UI.
- Image: It uses the
These services work together to create a monitoring stack that includes Rest-App, OpenTelemetry Collector, Prometheus, and Grafana. The collector collects telemetry data, Prometheus scrapes and stores metrics, and Grafana provides a user-friendly interface for visualizing and analyzing those metrics.
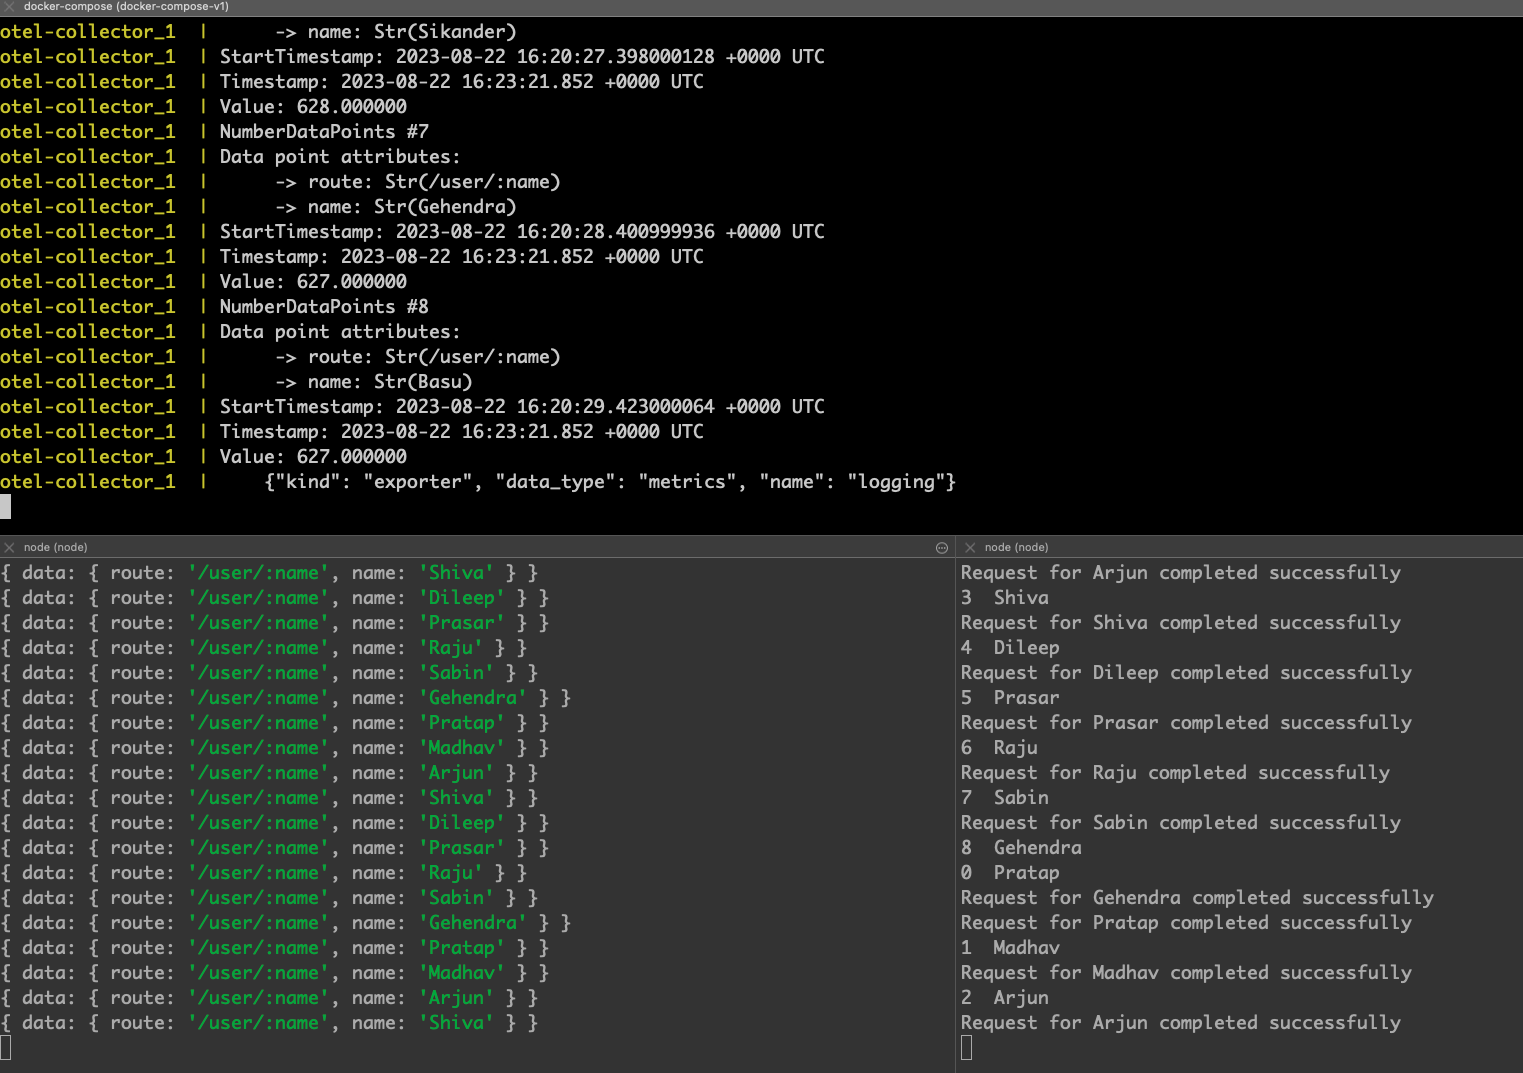
Running the Monitoring Stack
With all the configurations and code in place, it's time to run the monitoring stack. Open your terminal, navigate to the project directory, and run:
$ docker-compose up
This command will start the OpenTelemetry Collector, Prometheus, and Grafana containers. You can access Grafana at http://localhost:3000, Prometheus at http://localhost:9090, and the Node rest-app at http://localhost:8080.
With this, we have our server up and running in http://localhost:8080, now it's time to make a request to the webserver. In order to achieve a real-world scenario. Create a new file trigger.js inside the folder rest-app. The purpose of this file is to make a request to our webserver every seconds which will increments a metric (counter) called learn-with-pratap by 1. We can then monitor this metrics later in Grafana dashboard.
const axios = require("axios");

const names = [
  "Pratap",
  "Madhav",
  "Arjun",
  "Shiva",
  "Dileep",
  "Prasar",
  "Raju",
  "Sabin",
  "Gehendra",
];

function callApi(name) {
  axios
    .get(`http://localhost:8080/user/${name}`)
    .then((response) => {
      console.log(`Request for ${name} completed successfully`);
    })
    .catch((error) => {
      console.error(`Error making request for ${name}: ${error.message}`);
    });
}

let index = 0;

setInterval(() => {
  console.log(`${index}  ${names[index]}`);
  callApi(names[index]);

  if (index === names.length - 1) {
    index = 0;
  } else {
    index++;
  }
}, 10); // Adjust the interval (in milliseconds) as needed
Now, in another terminal window run the trigger.js script which will make a request to the Express server in every 10 miliseconds.
$ node trigger.js
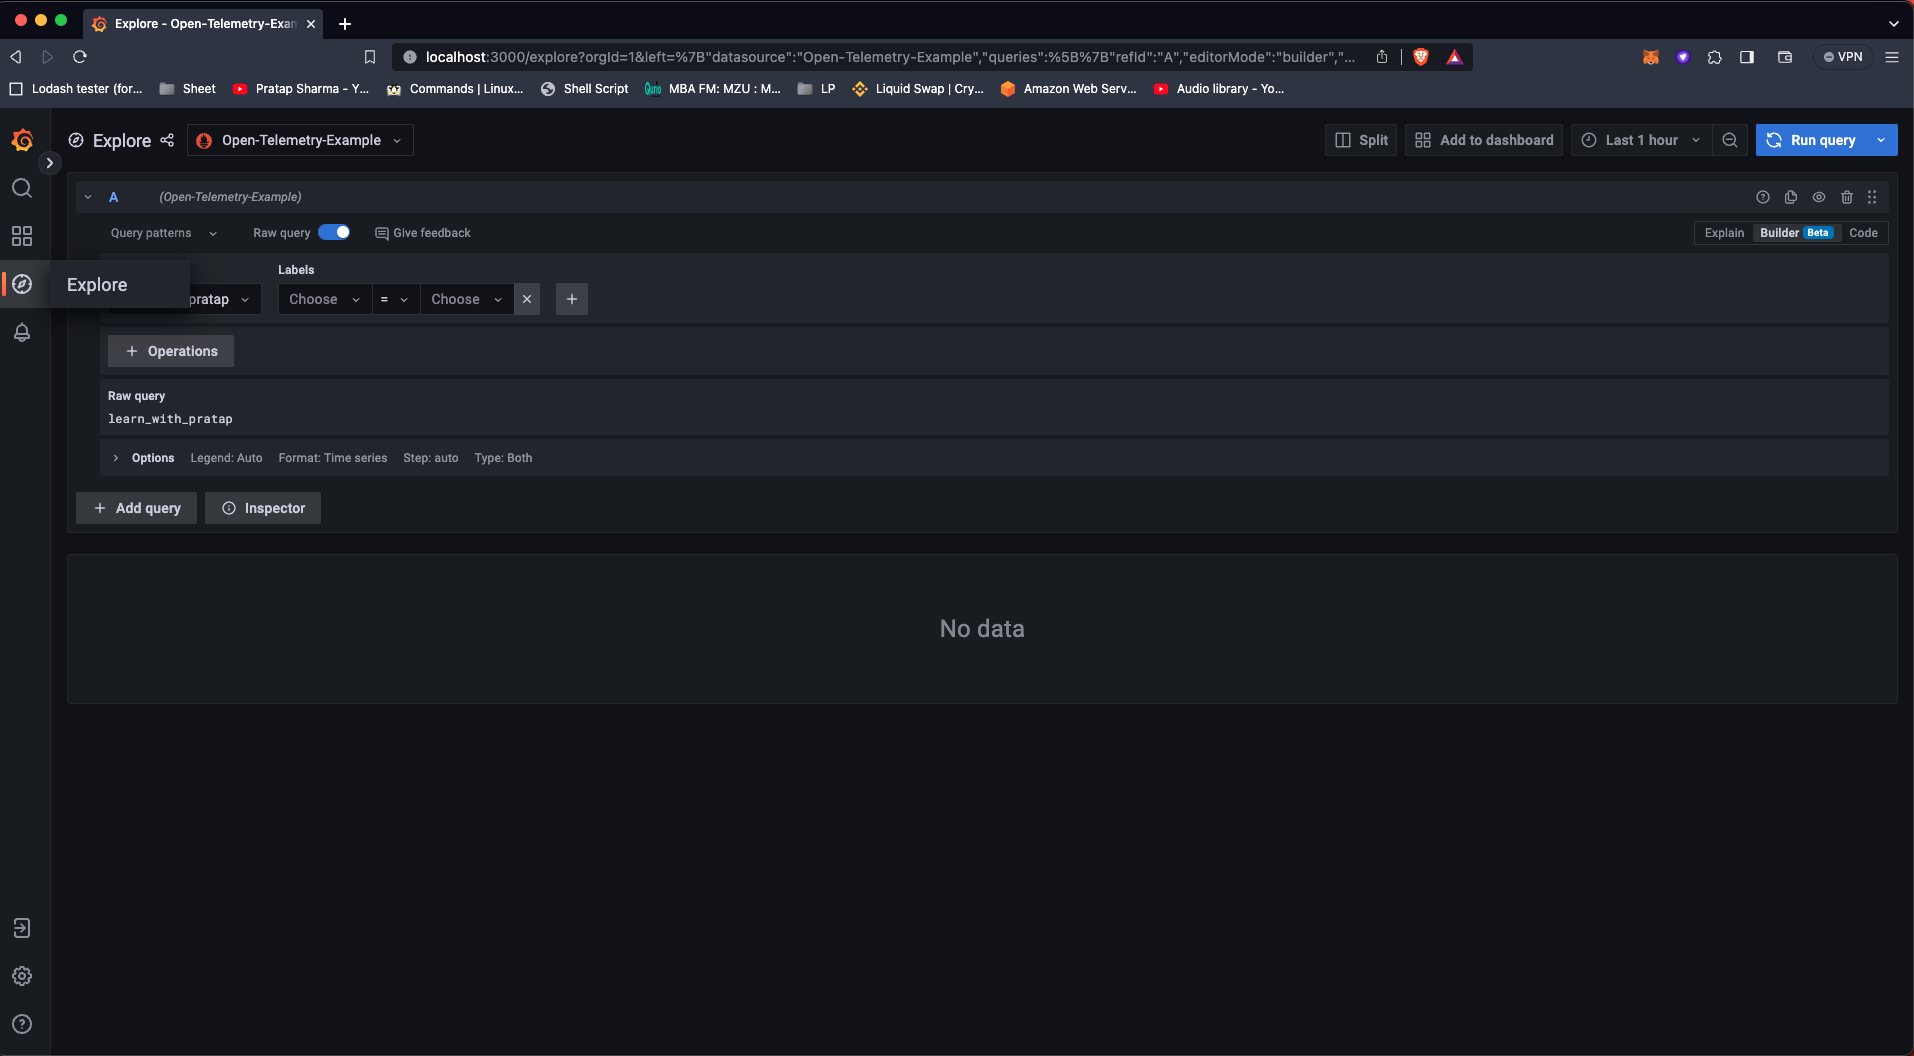
Visualizing Metrics
Now it's finally time to Visualize our metrics in Grafana Dashboard.
Follow the steps as mentioned in the image below.
- In the side navigation bar click on Explore
- In the panel configuration, select your data source Open-Telemetry-Example from the dropdown."
- Use PromQL queries to select the metrics you want to visualize. For example, you can visualize the
learn-with-prataporlearn_with_pratapcounter metric. - Now click on Run Query at the top-right corner.
- Now, you should be able to see metrics in the Grafana Dashboard.
At the end our files and folder startcture would look as shown below:
├── collector
│   └── otel-collector-config.yaml
├── docker-compose.yaml
├── grafana
│   ├── grafana.ini
│   └── provisioning
│       ├── dashboards
│       │   └── opentelemetry-collector.json
│       └── datasources
│           └── default.yaml
├── grafana.zip
├── prometheus
│   └── prometheus.yaml
└── rest-app
    ├── Dockerfile
    ├── index.js
    ├── meter.js
    ├── package.json
    ├── trigger.js
    └── yarn.lock
A complete source code can be found here
Conclusion
By following this guide, you have set up a powerful monitoring stack using OpenTelemetry, Prometheus, and Grafana. You can now collect, store, and visualize important metrics from your applications. This stack provides valuable insights into your application's performance, helping you identify issues and optimize your software for a better user experience. Monitoring is an essential aspect of modern software development, and with these tools in your toolkit, you're well on your way to building more reliable and performant applications.
Learn More
- Architecture and Design Principle for Online Food Delivery System
- Beginner's Guide to HTTP Methods and Status Codes
- What is a Docker container?
Please let me know if there's anything else I can add or if there's any way to improve the post. Also, leave a comment if you have any feedback or suggestions.
Discussions