
Debugging a FastAPI and adding breakpoint is always difficult in python. So in this blog we will create a simple webserver using fastapi and try to debug by adding a breakpoint.
Debug using pdb Python's built-in debugger
Old and Popular way of debugging a python code is by using pdb which is Python's built-in debugger. Let me show you an example.
def add(a, b):
    return a + b

def subtract(a, b):
    return a - b

def main():
    x = 10
    y = 5
    result_add = add(x, y)
    result_subtract = subtract(x, y)
    print(f"Addition: {result_add}, Subtraction: {result_subtract}")

if __name__ == "__main__":
    main()
Suppose, we have this example.py file and we want to debug this code using pdb, we can insert pdb.set_trace() at the point where we want to start debugging. So let's update the above code.
import pdb

def add(a, b):
    return a + b

def subtract(a, b):
    return a - b

def main():
    x = 10
    y = 5
    pdb.set_trace()  # Start the debugger here
    result_add = add(x, y)
    result_subtract = subtract(x, y)
    print(f"Addition: {result_add}, Subtraction: {result_subtract}")

if __name__ == "__main__":
    main()
Now, when you run the script, the debugger will start at the pdb.set_trace() line. You can run the script from the command line as follows:
python example.py
The debugger will pause execution and give you a (Pdb) prompt, where you can enter various commands to inspect and control the execution of your script. Some useful commands are:
- n (next): Execute the next line of code.
- s (step): Step into the function call.
- c (continue): Continue execution until the next breakpoint.
- l (list): List source code around the current line.
- p (print): Print the value of an expression. For example, p x will print the value of x.
- q (quit): Quit the debugger and stop the program.
So, run the code and try the different command as mentioned above. It seems simple but is tedious. We have to go and add these few lines import pdb and then add pdb.set_trace().
Debug using VSCode
There is another very simple way to to add breakpoints and debug the python code using VSCode. So, let's learn how we can debug using vscode and add breakpoint.
Let's first create a simple webserver using fastapi. To do that follow the below simple steps.
- Lets create a directlory and set up a Virtual Environment
Create directory
mkdir fastapi-project
cd fastapi-project
Create a Virtual Environment
python -m venv venv
Now, activate the virtual environment
source venv/bin/activate
- Install FastAPI and Uvicorn
Now we have virtual environment activated, let install fastapi and uvicorn
pip install fastapi uvicorn
With this we have installed all the required dependencies to setup our simple server.
- Create a Basic FastAPI Application
Now, it's time to create a basic FastAPI application.
Create a file named main.py
touch main.py
And add the following code in the file
from fastapi import FastAPI

app = FastAPI()

@app.get("/")
def read_root():
    return {"name": "Pratap", "youtube": "Learn with Pratap"}

@app.get("/items/{item_id}")
def read_item(item_id: int, q: str = None):
    return {"item_id": item_id, "q": q}
- Run the FastAPI Application
We can run the application with the command below using uvicorn.
uvicorn main:app --reload
This command runs uvicorn with:
main:app: Refers to the app object in the main.py file.--reload: Automatically reloads the server when you make changes to the code.
- Access the FastAPI Application
Open your web browser and navigate to http://127.0.0.1:8000. You should see:
{ "name": "Pratap", "youtube": "Learn with Pratap" }
Setting Debugger
With this we have setup a simple webserver using fastapi. Now let us add configuration as needed for the VSCode. Lets us first add launch.json file.
Create a directory .vscode if not already exists.
mkdir .vscode
And inside the vscode directory create a file launch.json.
touch launch.json
And, now add the below content into the launch.json file.
{
  "version": "0.2.0",
  "configurations": [
    {
      "name": "Python: FastAPI",
      "type": "debugpy",
      "request": "launch",
      "program": "${workspaceFolder}/main.py",
      "console": "integratedTerminal",
      "args": [
        "run",
        "uvicorn",
        "main:app",
        "--reload",
        "--host",
        "127.0.0.1",
        "--port",
        "8000"
      ],
      "jinja": true
    }
  ]
}
In the above configuration:
${workspaceFolder}/main.pyis the path to your FastAPI application.argsspecifies the command to run uvicorn with the necessary parameters.main:apprefers to the FastAPI instance in main.py.
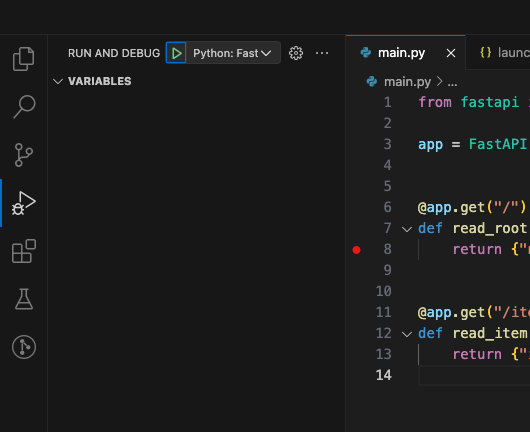
- Set Breakpoints:
Open main.py in VSCode and set breakpoints where you want to inspect the code.
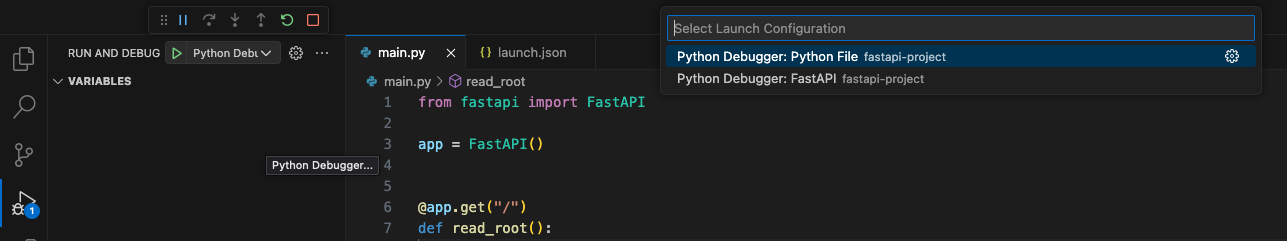
- Start Debugging:
Go to the Debug panel, select "Python: FastAPI" from the dropdown, and click the green play button to start debugging. VSCode will run uvicorn with your FastAPI app, and the debugger will attach to it.
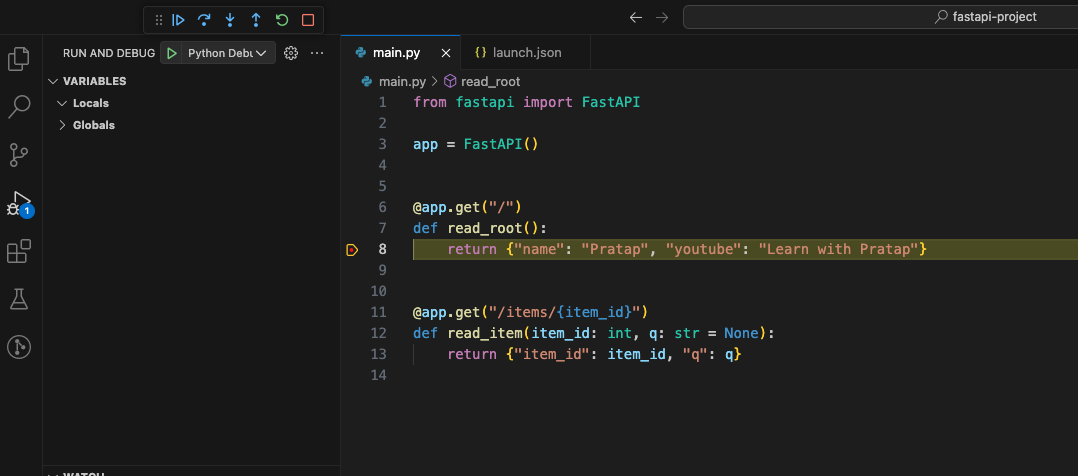
You should see the FastAPI application running, and you can use the VSCode debugger to step through your code, inspect variables, and use all the usual debugging features.
Complete Directory Structure:
fastapi-project/
│
├── .vscode/
│   ├── launch.json
├── venv/
│   ├── bin/
│   ├── include/
│   ├── lib/
│   └── ...
│
└── main.py
With this we have setup a a very simple way to debug python code using VSCode. It's so simple now that we can simply add breakpoints and start debugging.
Learn More
- A practical guide to data collection with OpenTelemetry, Prometheus and Grafana
- Beginner's Guide to HTTP Methods and Status Codes
- Flask and SQLAlchemy: Better Data Management
Please let me know if there's anything else I can add or if there's any way to improve the post. Also, leave a comment if you have any feedback or suggestions.
Discussions